

Your Website, Reconsidered
Core Web Vitals: The Three Numbers Google Checks on Your Five-Page Website
Google publishes three measurements of how a page feels to use, and the passing marks. Here is what they mean for a small business site, and how to check yours for free.
8 min readBy Mavlo
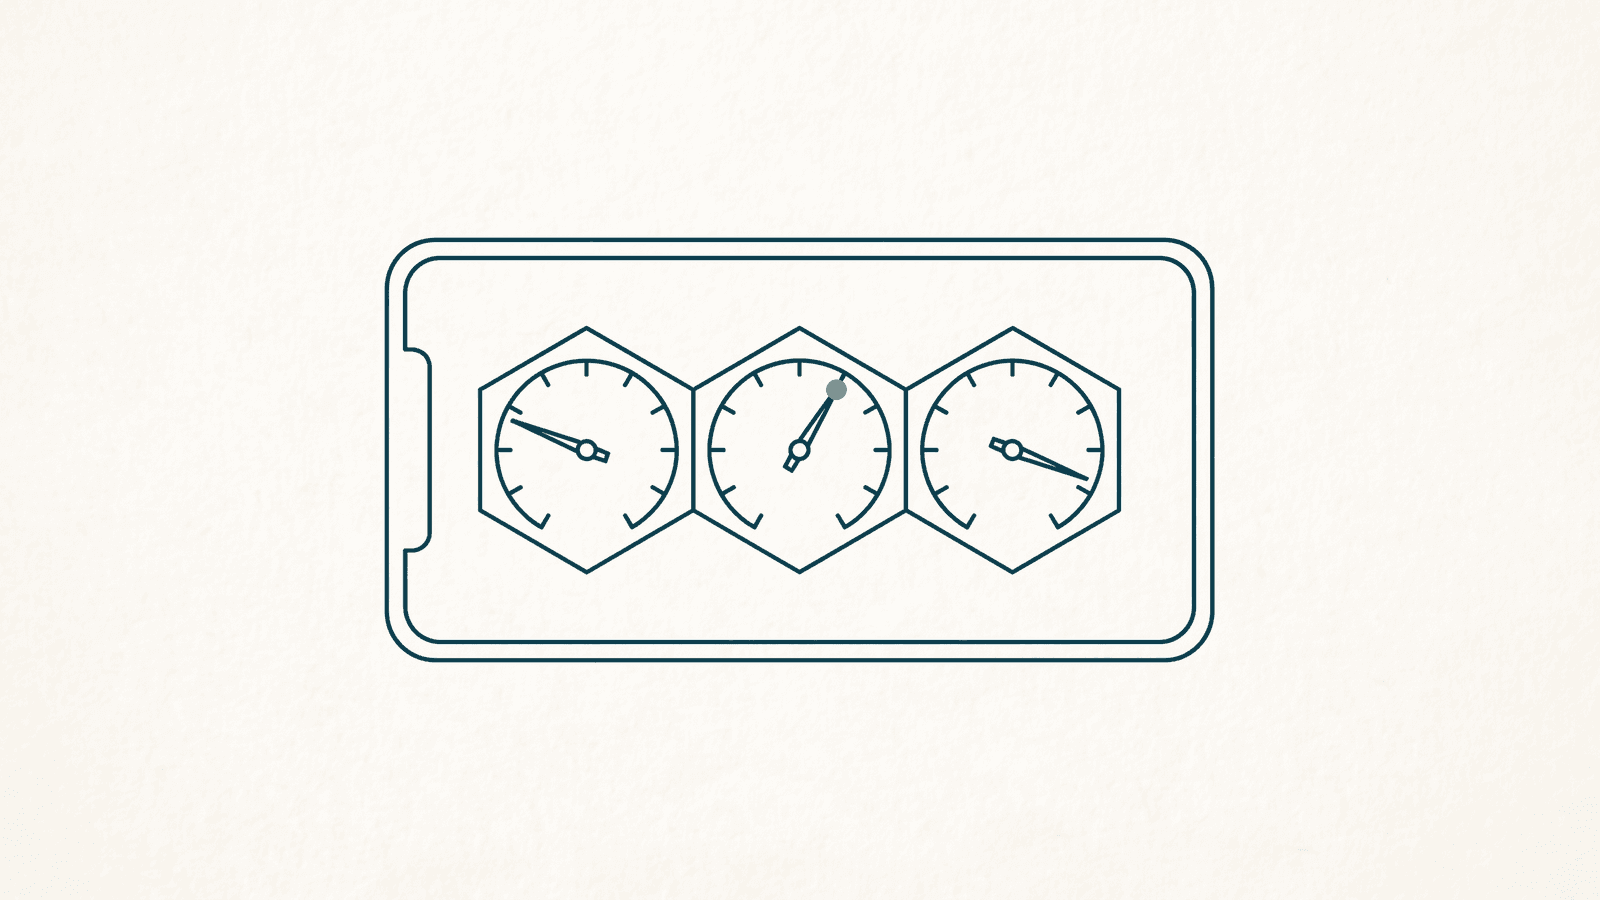
Google publishes three measurements of how a web page feels to use, and it tells you the passing marks. That is unusual. Most of search ranking is a black box; this bit has a scoreboard. The catch is that it was written for engineers, not for a Leicester café with a five-page site and no IT department. This is the translation.
What Core Web Vitals actually are
Core Web Vitals is Google’s name for three numbers: how long the main thing on the page takes to appear, how quickly the page reacts when you tap it, and how much it jumps about while loading. Each has a threshold Google calls good. To pass, your site has to hit it for most of your real visitors, which Google measures as the 75th percentile of page loads, split between mobile and desktop. In plain terms, three out of four visits have to feel fine, and since most people looking for a local business are on a phone, the phone score is the one that matters.
The three measurements, and what each feels like on a bus
LCP: how long until the big thing shows up
Largest Contentful Paint is the time from when someone taps your link to when the biggest thing in view has finished appearing, usually the hero photo or the main heading. Google’s threshold for LCP is 2.5 seconds or less for good; over 4 seconds is poor. What it feels like: a customer on the bus into town opens a Leicester restaurant’s menu page and looks at a grey space where the photo of the food should be. Four seconds is a long time to stare at nothing. Many have already tapped the next place.
INP: how long a tap takes to do something
Interaction to Next Paint measures how long the page takes to visibly respond after you tap, click or type. Good is 200 milliseconds or less; above 500 is poor. INP replaced an older measurement called First Input Delay, so if an old report mentions FID, that is why. What it feels like: a Loughborough gym has a Book a class button. Someone taps it and nothing happens. They tap again. Now both taps register, the page lurches, and the form opens with the wrong class selected. A tap that gets no visible answer for half a second feels broken, and people treat it as broken.
CLS: how much the page jumps around
Cumulative Layout Shift is a score for how much the page moves unexpectedly while it loads. It is not measured in seconds; it is a number where 0.1 or less is good and anything above 0.25 is poor. Google lists the usual culprits: images and videos with unknown dimensions, fonts that render at a different size from their fallback, and third-party ads or widgets that resize themselves. What it feels like: the customer finds your opening hours, goes to tap Call, and at that moment a cookie banner loads above it and shoves everything down an inch. They have now tapped Directions instead. Nobody phones to complain about this. They close the tab.
Check your own site in five minutes
PageSpeed Insights is Google’s free checker. You paste in a page address, wait about thirty seconds, and get a report. Run it on your homepage and on your contact or booking page.
The report has two halves, and they can disagree. The top half is field data: what real Chrome users experienced on your site recently. It comes from Google’s Chrome User Experience Report and decides the pass or fail. The honest caveat is that a five-page site for a barber in Oadby may not have enough visitors for Google to publish a number at all. When one page lacks data, the tool falls back to figures for the whole site; when the whole site lacks data, it says so and shows nothing. That is not a failure; it means you rely on the second half.
The second half is lab data: a simulated load on one device over a fixed, deliberately mediocre connection. It is a diagnostic, not a verdict. Google’s own documentation says lab data is useful for debugging but may not capture real-world bottlenecks, while field data captures true user experience with fewer metrics. Read the lab section for the list of specific problems, then check the field section, if you have one, to see whether those problems are actually biting.
- Paste your homepage address into PageSpeed Insights and make sure the Mobile tab is selected. That is the one your customers see.
- Look for the field data section. If it says there is no data, note that and move on.
- Scroll to the diagnostics and write down the top three complaints. Those go to your web person.
What Google actually says about ranking
This is easy to overstate, so here is the position from Google’s own page-experience documentation. There is no single page-experience signal; Google says its ranking systems look at a variety of signals that align with overall page experience. Search always tries to show the most relevant content, even if the page experience is sub-par. But for many queries there is lots of helpful content available, and there a great page experience can contribute to success. Google recommends good Core Web Vitals, and in the same breath says a green report does not guarantee a top ranking.
The reading for a local business: a fast site will not lift a thin one to the top of the map. But when you and four other plumbers in Wigston have similar reviews and similar pages, the site that loads and responds properly is the one Google has less reason to hold back. Speed is one of the few technical things Google scores in the open; structured data is another. And ranking is only half of it. Google may or may not reward the fast site; the customer on the bus certainly punishes the slow one.
The five fixes that cover most small sites
A five-page site rarely needs a performance engineer. Most failures share a handful of causes.
1. Oversized images
The commonest problem by a distance. Someone uploaded the 6 MB photo straight from the phone, and the site now sends a poster-sized file to be shown at the width of a thumb. Resize images to roughly the size they will be shown at, and save them in a modern format such as WebP, which is much smaller than a JPEG of the same picture. Most site builders can do this automatically once it is switched on. It is usually the biggest LCP win going.
2. Too many third-party scripts
Chat widgets, review carousels, booking embeds, three analytics trackers, a Facebook pixel from a campaign that finished in 2023. Each is someone else’s code your page has to fetch and run before it feels ready, and together they are the usual cause of a poor INP. Keep only the ones you use. If nobody has answered the live chat since it went in, it is costing you more than it earns.
3. No image dimensions
When the browser does not know how tall a photo will be, it leaves no room for it, then pushes everything down when the photo arrives. That is where most of a CLS score comes from. The fix is a set size for every image and embed, a small technical job rather than a redesign. The cookie banner should take its space from the start too, not land on the button someone was about to press.
4. A slow or cheap host
Every page starts with a wait for the server to answer, and a bargain shared plan with hundreds of other sites on the same machine can make that wait long before your page gets a chance to be fast. If the lab report flags a long server response time, image work will not fix it. Moving host is less dramatic than it sounds.
5. A heavy theme or builder
Some themes and page builders load every feature they own on every page, whether the page uses it or not: sliders, animation libraries, icon sets, ten fonts. A five-page site on top of that is carrying a lot it does not need. Sometimes the cure is trimming the theme’s settings; sometimes it is cheaper to rebuild on something lighter, which is the kind of rebuild we mean. It is also why a Mavlo listing page is deliberately light: someone tapping through to you from a directory should not be kept waiting either.
What to ask your web person
You do not need to fix any of this yourself. You need to ask for it in words that get a straight answer. Take your notes and ask:
- What are our mobile LCP, INP and CLS scores, and are any of them outside Google’s good range?
- Are our images resized and served in a modern format, or are we uploading originals?
- Which third-party scripts load on the homepage, and what is each one for?
- Does every image and embed have its dimensions set so the page doesn’t shift?
- What is our server response time, and would a better host change it?
- Can you show me the before and after in PageSpeed Insights once it’s done?
If the answers come back as jargon, ask again in seconds and milliseconds. A shrug tells you something too.
If it fails all three
A site that misses every threshold is very likely showing several of the other signs a website is quietly turning customers away too. Start with speed. It is the one you can measure.
Key takeaways
- Three numbers, three passing marks: LCP 2.5 seconds or under, INP 200 milliseconds or under, CLS 0.1 or under, judged on the mobile score.
- Check it free with PageSpeed Insights. A small site may have no field data; use the lab diagnostics to find what to fix.
- Google treats page experience as one factor among many. It won’t rescue thin content, but it can decide close contests.
- Five fixes cover most small sites: image size, third-party scripts, image dimensions, hosting, and a heavy theme.
Want us to look at your site?
We run the same checks on every business we work with and show you the before and after. No jargon, no obligation.
See how it works →Keep exploring


Browse the directory
Everything above, working in practice — real listings, in a real place.